
Meaning of List of sections in Call Tree in Instruments in Xcode Instruments
Meaning of List of sections in Call Tree in Instruments in Xcode Instruments
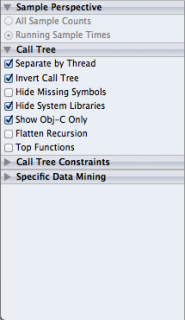
Separate by Thread: Each thread should be considered separately. This enables you to understand which threads are responsible for the greatest amount of CPU use.
Invert Call Tree: With this option, the stack trace is considered from top to bottom. This means that you will see the methods in the table that would have been in frame 0 when the sample was taken. This is usually what you want, as you want to see the deepest methods where the CPU is spending its time.
Hide Missing Symbols: If the dSYM file cannot be found for your app or a system framework, then instead of seeing method names (symbols) in the table, you’ll just see hex values. These correspond to the address of the instruction within the binary code. If this option is selected, then these are hidden, and only fully resolved symbols are displayed. This helps to declutter the data presented.
Hide System Libraries: When this option is selected, only symbols from your own app are displayed. It’s often useful to select this option, since usually you only care about where the CPU is spending time in your own code – you can’t do much about how much CPU the system libraries are using!
Show Obj-C Only: If this is selected, then only Objective-C methods are displayed, rather than any C or C++ functions. There are none in your program, but if you were looking at an OpenGL app, it might have some C++, for example.
Flatten Recursion: This option treats recursive functions (ones which call themselves) as one entry in each stack trace, rather than multiple.
Top Functions: Enabling this makes Instruments consider the total time spent in a function as the sum of the time directly within that function, as well as the time spent in functions called by that function. So if function A calls B, then A’s time is reported as the time spent in A PLUS the time spent in B. This can be really useful, as it lets you pick the largest time figure each time you descend into the call stack, zeroing in on your most time-consuming methods.