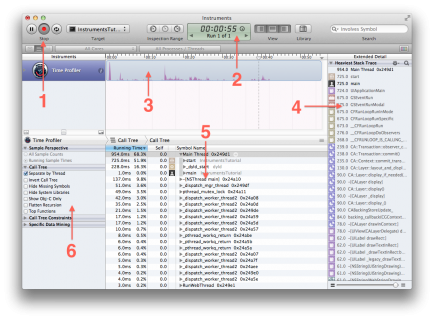
Each Section of Instruments in Xcode and its Meaning

- These are the recording controls. The middle red button will stop & start the app currently being profiled when it is clicked. This is actually stopping and starting the app — not pausing it.
- This is the run timer and run navigator. The timer counts how long the app being profiled has been running. The arrows move between runs. If you stop and then restart the app using the recording controls, that would start a new run. The display would then show “Run 2 of 2”, but you could get back to the data of the first run by first stopping your current run, then pressing the left arrow to go back.
- This is called a track. In the case of the time profiler template you selected, there’s just one instrument so there’s just one track. You’ll learn more about the specifics of the graph shown here later in the tutorial.
- This is the extended detail panel. In the case of the time profiler instrument, it’s used to show stack traces, as that is what Instruments is recording.
This is the detail panel. It shows the main information about the particular instrument you’re using. In this case, it’s showing the methods which are “hottest” — that is, the ones that have used up the most CPU time. - If you click on the bar at the top which says “Call Tree” (the left hand one) and select “Sample List”, then you are presented with a different view of the data. This view is showing every single sample. Click on a few samples, and you’ll see the captured stack trace appear in the extended detail panel.
- This is the options panel. You’ll be learning more about these options shortly.